Numbers that actually mean something
Revenue, margins, roast volume, and customer profitability, all calculated automatically from your real operational data. No manual spreadsheets.
Revenue Trends
Weekly, monthly, yearly
COGS Tracking
Per product and order
Margin Analysis
Customer and product level
Roast Volume
Capacity and utilization
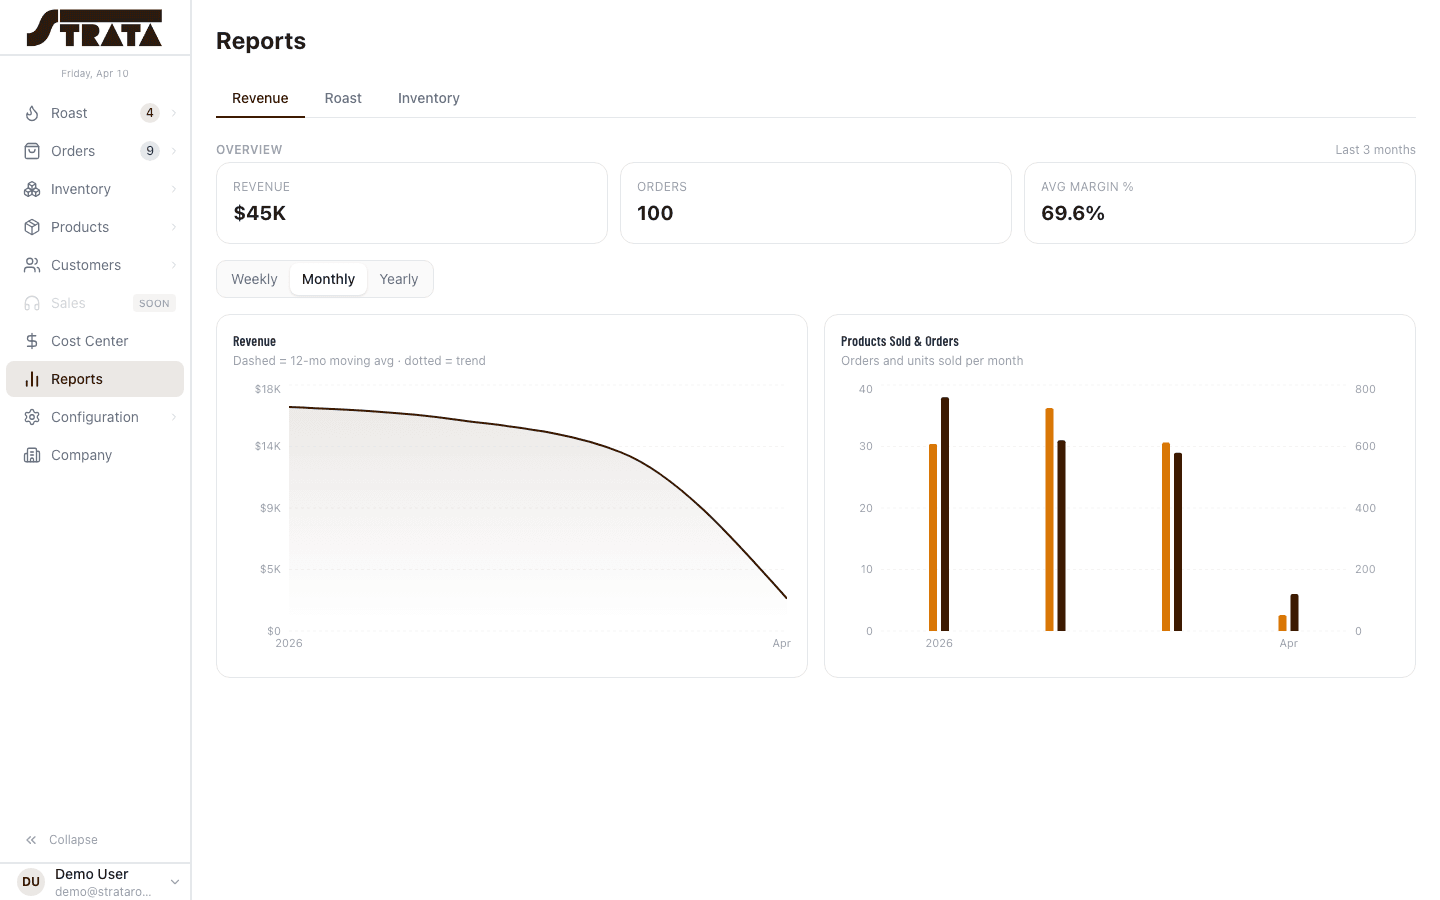
Revenue trends
Track your revenue weekly, monthly, and yearly. See rolling averages, compare periods, and spot seasonal patterns before they become surprises.
- Weekly revenue with configurable reset day
- Monthly and yearly aggregations
- 12-month rolling average overlay
- Gross profit trend alongside revenue
Roast volume and capacity utilization
Know how hard your roasters are working. Track weekly roast volume against historical highs and monitor average batch sizes to optimize throughput.
- Weekly lbs roasted vs. historical high
- Average charge weight per batch
- Batch count tracking over time
- Capacity utilization percentage
COGS tracking and product margins
Full cost-of-goods tracking from green coffee purchase through finished product. See your margin on every SKU, every order, and every customer.
- Automatic COGS calculation from purchase history
- Per-product margin and COGS percentage
- Historical COGS reconstruction by date
- Projected COGS% for planned price changes
Customer profitability analysis
Not all customers are equal. STRATA shows you revenue, COGS, gross profit, and margin for every customer, so you know who drives your business.
- Per-customer revenue and gross profit
- Customer-level COGS percentage
- Order volume and average order value
- Sortable profitability rankings
Green coffee cost trends by origin
Track how your green coffee costs change over time, broken down by origin. Spot price increases early and adjust your product pricing proactively.
- Cost-per-pound trend by origin
- Purchase history with supplier details
- Retention-factor-adjusted roasted cost
- Blend cost breakdown by component
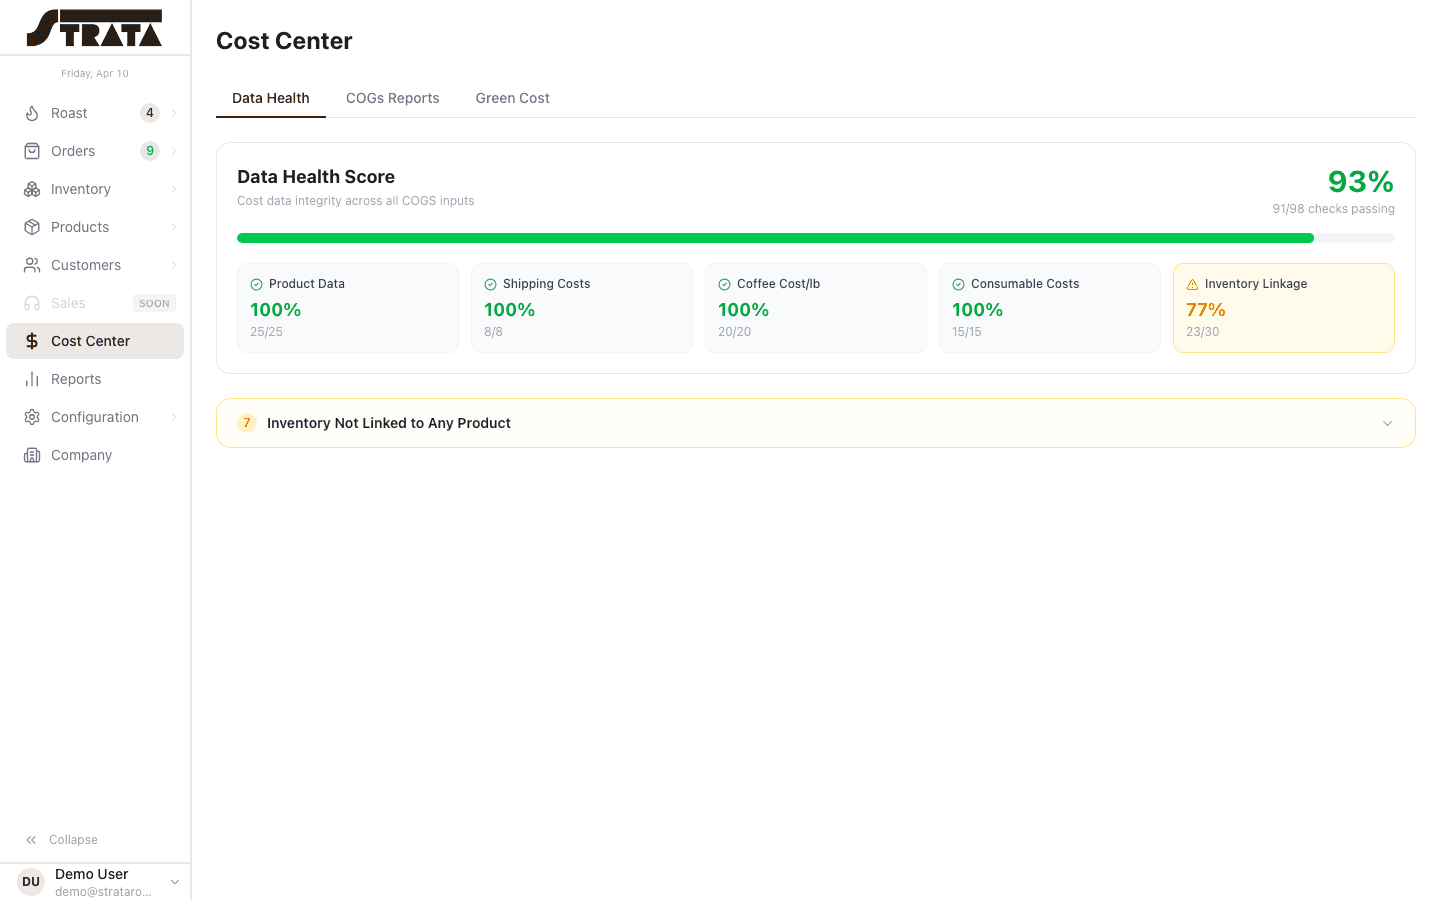
Cost and data health monitoring
A dedicated dashboard within Cost Center that watches for data quality issues, missing costs, orphaned records, and configuration gaps, so you can trust the numbers your reports show.
- Missing cost alerts on products
- Orphaned record detection
- Configuration completeness checks
- Data quality score dashboard
Ready to see your real numbers?
Start your free 30-day trial or explore the interactive demo. No credit card required.